India's T&C Exports Fall 0.74% In Q1FY 2018-19
India's T&C Exports Fall 0.74% In Q1FY 2018-19

India's textile and clothing exports have witnessed a positive trade balance with growth of 0.17% to US$ 11358.31 million in the first quarter (Q1) of FY 18-19 over the same quarter of the previous fiscal year. In the Q1 of FY 18-19, the exports of T&C stakes 84% share from the total T&C trade with value of US$ 9487.38 million. USA is the topmost export market for India's T&C goods. USA totalled an export value of US$ 2001.62 million in the Q1 FY 18-19 with a growth of 2.51% over the same quarter of the previous fiscal year. Woven apparel is the major commodity exported to USA with value of US$ 567.64 million, growth of 3.06%.
Whereas in the import segment, China is the leading sourcing destination for India's T&C imports. China exports to India totalled to US$ 642.02 million but perceived a negative growth of -10.30% in the Q1 FY 18-19 and the country stakes 34% share in India's T&C imports of the first quarter of this fiscal year. From China majorly textile fabrics was imported to India in the Q1 FY 18-19 with value of US$ 142.41 million, falling by -11.85%.
Exports
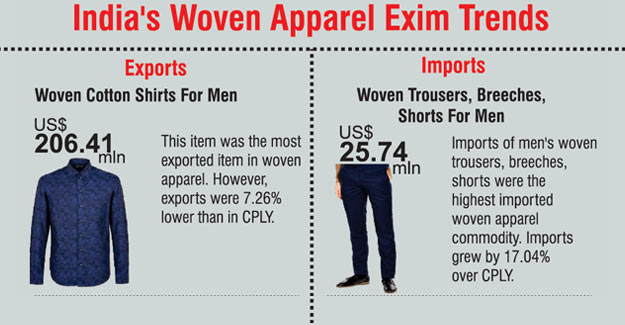
India's T&C exports in the Q1 FY 18-19 have witnessed a negligible drop of 0.74% in Q1 FY 18-19. The topmost commodity in the export segment is woven apparels with export value of US$ 2193.58 million, but the commodity has perceived a drop of 14.47% in the Q1 FY18-19 over the same quarter of the previous fiscal year. The commodity stakes 23% share from the total exports of T&C in the Q1 FY18-19. Woven apparel exports have witnessed the drop as demand from Afghanistan, Australia, Brazil, Bangladesh, etc., have fallen. Woven apparel exports to Afghanistan dropped by 39.97% to US$ 29.02 million in the first quarters of FY 18-19. In the same segment Australia has registered a drop of -15.05% to US$ 17.5 million and Brazil has perceived a negative growth of 11.15% to US$ 13.48 million. Exports to Bangladesh at US$ 12.2 million, registered a whopping decline of 54.16% in Q1 FY 18-19 over the same period of the previous fiscal year. USA was India's largest market for woven apparel during this quarter, with exports of US$ 567.64 million. Under this segment, men's or boy's shirts made from cotton were the most exported item, with a value of US$ 206.41 million, however, this was 7.26% lower than in the corresponding period of last year (CPLY). The item fetched an average unit value realisation of US$ 0.16 per piece.
Knitted fabrics exports have witnessed a growth of 43.59% to US$ 105.94 million in Q1 FY 18-19 over the same period in the previous fiscal. Bleached or unbleached knitted fabric of cotton was exported most in this segment with value of US$ 29.08 million.
Silk exports have shown a growth of 7.42% to US$ 20.86 million in Q1 FY 18-19 over the CPLY.
Carpets and other textile floor coverings exports registered a drop in the Q1 by 1.83% to US$ 420.70 million over the same quarters of the previous fiscal. But if compared between three months of the same quarter, the commodity has shown a growth of 11.9% in May 2018 compared to the previous month exports. In June 2018 the exports dropped by 2.29% over the May month exports.
In man-made staple fibre commodity, staple fibre made from polyester exports totaled US$ 83.38 million, growth of 39.09% in Q1 FY 18-19. Polyester staple fibre was exported at a price of US$ 0.79 per kg, whereas in the same quarter in previous fiscal the commodity was exported at rate of US$ 0.92 per kg. Fabrics of polyester staple fibre mainly mixed with viscose rayon staple fibre was second top exported commodity in MMSF segment in the Q1 FY 18-19 with an export value of US$ 72.72 million. This fabric was sold at a price of US$ 0.68 per metre in the Q1 FY 18-19 while the same fabric was sold at a price of US$ 0.78 per metre in the same quarter of the previous fiscal.
India's T&C markets
Country-wise, United State of America (USA) is the largest export market for India's textile and clothing products. In the first quarter of FY 18-19, exports to USA totalled US$ 2001.62 million with a growth of 2.51% and stakes 21% in India's T&C export for Q1 FY 18-19. In USA, India's apparel exports are ruling the basket with a stake of 52% from the total T&C exports to USA. India's apparel exports to the USA during the quarter totalled US$ 1040.38 million, growing by 6.10% of the CPLY. India's exports of carpets and other textile floor coverings have been in much demand in USA. The commodity has witnessed a growth of 2.58% in Q1 FY 18-19.
Surprisingly, Vietnam has become India's second largest export market for T&C. Exports to Vietnam during the quarter were to the tune of US$ 1776.61 million with a growth of 17.30%. Exports to Vietnam have increased mainly owing to increase in cotton exports which totalled to US$ 143.95 million in Q1 FY 18-19 over the previous fiscal year's export which totalled to US$ 92.72 million.
China is another important market for India's T&C exports, and mainly for Indian cotton. China has become India's fourth largest export market for T&C. India's exports to China went up by 190.04% in Q1 FY 18-19 with total of US$ 599.68 million. India's cotton was heavily exported to China in the quarter, making China the largest market for Indian cotton. India's cotton exports to China totalled to US$ 491.39 million with growth of 313.09% in Q1 FY 18-19 over the previous fiscal year.
T&C exports to UAE continue to fall. Exports went down by as much as 54.83% to US$ 653.43 million in Q1 FY 18-19 over the CPLY. But the country still remains the third largest export market for India's T&C goods. The country has witnessed a major drop in the apparel exports. Knitted apparels dropped by 62.83% and woven apparel by 57.94%.
With increased cotton exports to Pakistan, the country has emerged as an important market for India. India's T&C exports to Pakistan increased by 73.17% in the Q1 FY 18-19 totaling to US$ 196.96 million over the same quarter of the previous fiscal year.
India's T&C imports
India's T&C imports from the world in Q1 FY 18-19 registered a growth of 5.04% totaling to US$ 1870.93 million. The topmost commodity in this segment is man-made staple fibre (MMSF) with an import value of US$ 290.20 million with high growth of 65.02% in the Q1 FY 18-19 over the same quarter of the previous fiscal year. MMSF stakes 16% share from the total T&C imports in Q1 FY 18-19.
In MMSF, fabric made from polyester staple fibre was the maximum imported item in this commodity. The same fabric was imported at an average price of US$ 0.40 per metre in Q1 FY 18-19 whereas in the same period of the previous fiscal the average price was US$ 0.66 per metre. Staple fibre of polyester which was the second most imported item under this commodity was traded at an average price of US$ 0.71 per kg whereas in the previous fiscal year's same quarter the item was traded at an average price US$ 0.87 per kg.
Cotton imports stakes 15% share in this segment which totalled to US$ 289.17 million, but the commodity has perceived a negative growth of 25.47% in the Q1 FY18-19 over the same quarter of the previous fiscal year. USA is the topmost market for India's cotton import with a total of US$ 172.33 million. Raw cotton was imported at a price of US$ 0.46 per kg.
Man-made filament (MMF) was imported with a minimal growth of 4.39% to US$ 221.60 million in the Q1 FY 18-19 over the previous fiscal year. MMF stakes 12 % from the total T&C imports of India. Under this commodity, elastomeric items were traded the most with a value of US$ 31.13 million in Q1 FY 18-19 at an average price US$ 0.17 per unit. Another top item imported was high tenacity yarn of polyester and was traded at an average price of US$ 0.47 a unit.
Imports of carpets and other textile floor coverings witnessed a growth of 13.89% to US$ 30.67 million in the Q1 of FY 18-19. Nylon and other polyamides carpets were imported at a value of US$ 12.24 million, but have perceived a negative growth of 11.05%. The nylon and other polyamides carpets were traded at an average price of US$ 0.07 per sq. meter.
India's apparel imports have gone up significantly in this quarter against the previous year's same quarter. Woven apparel imports totalled US$ 195.70 million with a growth of 40.23% in Q1 FY 18-19. Bangladesh was the top exporter of woven apparel to India. The neighbouring country exported woven apparel worth US$ 43.82 million with a growth of 69.42%, during the quarter.
Under this commodity; trousers, breeches and shorts made of cotton for men were traded the most in India from the world. The imports totalled to US$ 25.74 million at average price of US$ 0.25 per piece in Q1 FY 18-19, whereas the same item was traded at an average price of US$ 0.49 per piece in the Q1 FY 17-18. Imports of woven shirts made of cotton for men were valued at US$ 13.49 million in Q1 FY 18-19 and per piece was traded at average price of US$ 0.13 per piece.
Knitted apparel imports totalled to US$ 83.65 million in Q1 FY 18-19 with growth of 31.77% over the previous fiscal same quarter. China is the leading exporter of knitted apparels to India. China exported knitted apparel worth US$ 36.48 million and perceived a growth of 15.20% in the Q1 FY 18-19.
T-shirts made of cotton, valued of US$ 10.70 million in the first quarter of FY 18-19 registered a growth of 23.21% over the previous fiscal same quarter. T-shirts were traded to India at an average price of US$ 0.71 per piece.
India's sourcing markets
Country-wise, China is the largest sourcing market for India's T&C goods. In Q1 FY 18-19, India imported T&C goods worth US$ 642.02 million from China, but witnessed a drop of 10.30% in the same period. A fall in imports from China is registered in many commodities - cotton imports went down by 25.47%, silk by 23.57%, knitted fabrics 14.28%, textile fabrics 3.09% and woven fabrics 1.86% in the Q1 FY 18-19 over the same period of the previous fiscal.
USA is the second largest T&C exporter to India, but imports from USA registered a fall of 4.17% during this quarter. India imported T&C goods worth US$ 215.35 million from USA during the quarter. Cotton is the major commodity imported from USA, but in Q1 cotton imports witnessed a drop of 5.27% to US$ 172.33 million over the same quarter of the previous fiscal year.
Imports from Bangladesh registered a growth of 39.77% to US$ 105.15 million in the Q1 FY 18-19. All the commodities have shown a good trend in the quarter except manmade filaments, nonwoven and special woven fabrics. Woven apparel was majorly exported to India from Bangladesh with value of US$ 43.82 million. Other important sourcing destinations include Egypt, Vietnam, Korea, Indonesia, Thailand and Taiwan.


 textileexcellence


